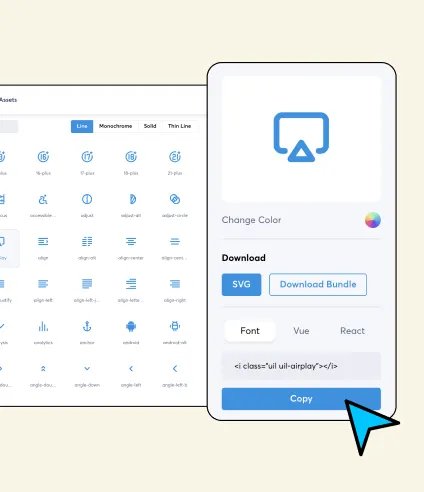
Data Visualizes the portrayal of data as a graph, outline, picture, or any introduction "data visualization can likewise be utilized as a revealing apparatus" an outline, chart, picture, and so on that is made as a visual portrayal of data. Data visualization is the demonstration of taking (data) and putting it into a visual setting, for example, a guide or chart. Data visualizations make all shapes and sizes data simpler for the human mind to comprehend, and visualization additionally makes it simpler to recognize examples, patterns, and exceptions in gatherings of data. Here we are offering you Data visualization that comprises everything that ought to be found in the Data Visualization venture. trust you will appreciate