
9 creative resources to design Infographics
Here is a list of 9 resources that are required to design infographics, its worthy of a read scroll down now!
Just like its processing, images are quick to look at for human minds. Thereby, infographics are best used to convey complicated data and information in a simpler manner. Hence, since past few decades, the portmanteau of information and graphic has achieved an exponential rise. The roots of this viral concept can be traced back to ancient age where people used cave drawings to propagate information.
This colorful visual representation of data has obtained the highest spot among varied ways of content marketing. Infographics, with its engaging hues and designs has the potential to turn a boring subject into an attractive content. It comprises of bar graphs, pie charts, line charts, UML drawings, tree diagrams, Gantt charts, network diagrams etc. It is widely used in spreading as well as comparing awe-inspiring astronomical statistical data. Having organized in an infographic, it is easier to derive meaning from the data quickly. Furthermore, patterns and relationships, and the mechanics of any matter can be effortlessly described by it.
This appealing and digestible creation to viewer’s eyes has a complex generation process. Though there are some marvelous designer tools available, getting familiar with it can be very tricky and time consuming. For those facing this problem, infographic tools have emerged as a panacea. Therefore, Iconscout presents you our collection of the best of these utilities.
1. Canva
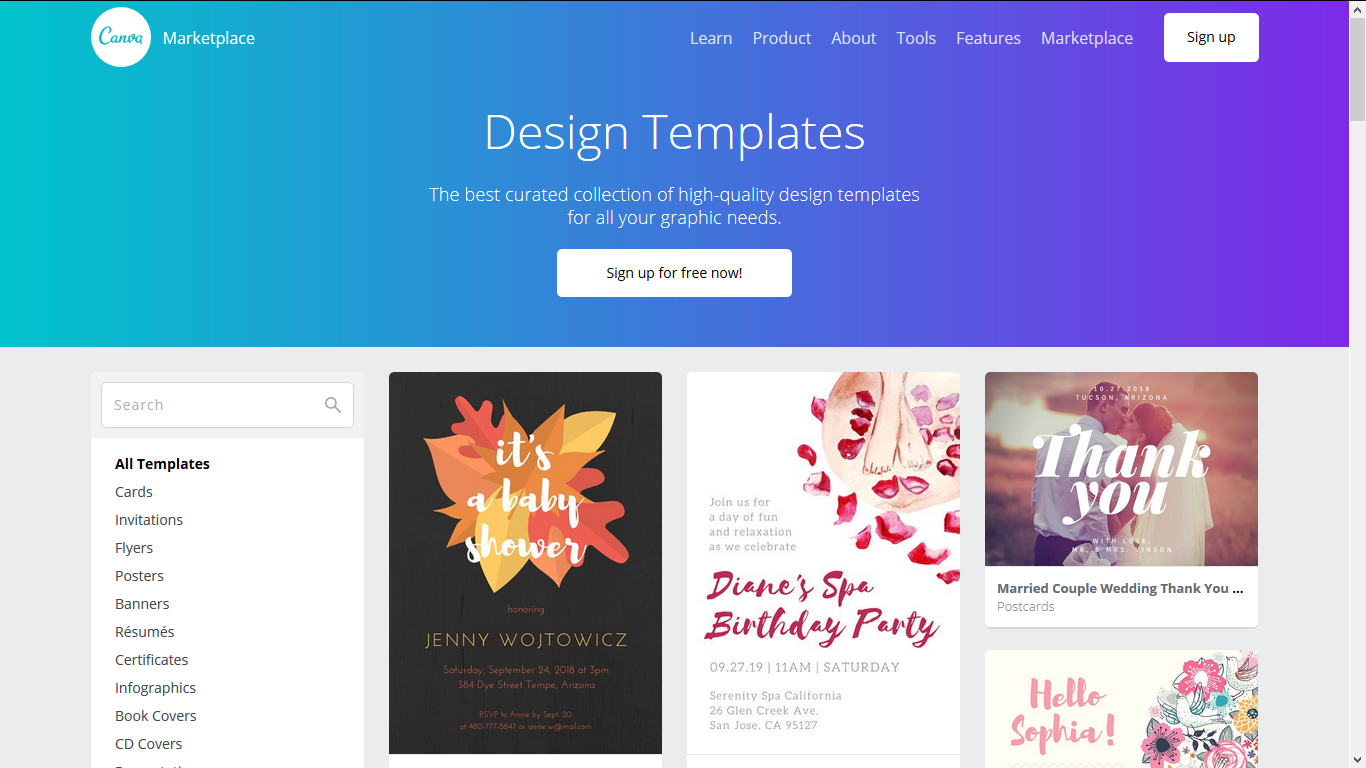
Whether you are a professional designer or a graphical novice, Canva walks you through its tutorial to design infographics in the initial stage. This easy-to-use online tool can be accessed through browser or Canva iPad app. It is a one stop destination for every requirement, from brochures to presentations. Moreover, it has a great collection of icons, fonts, images which are freely available along with many premium add-ons which can be bought for $1.
2. Infogr.am
Infogr.am is a free powerful tool enabling any individual to create an infographic in an unchallenging manner. Out of over 2 million infographics generated here, some are used by honorable organizations. It uses an easily editable Excel style spreadsheet to customize the data for infographic. With any variation in the data, the software automatically adjusts the look of the infographic.
3. Piktochart
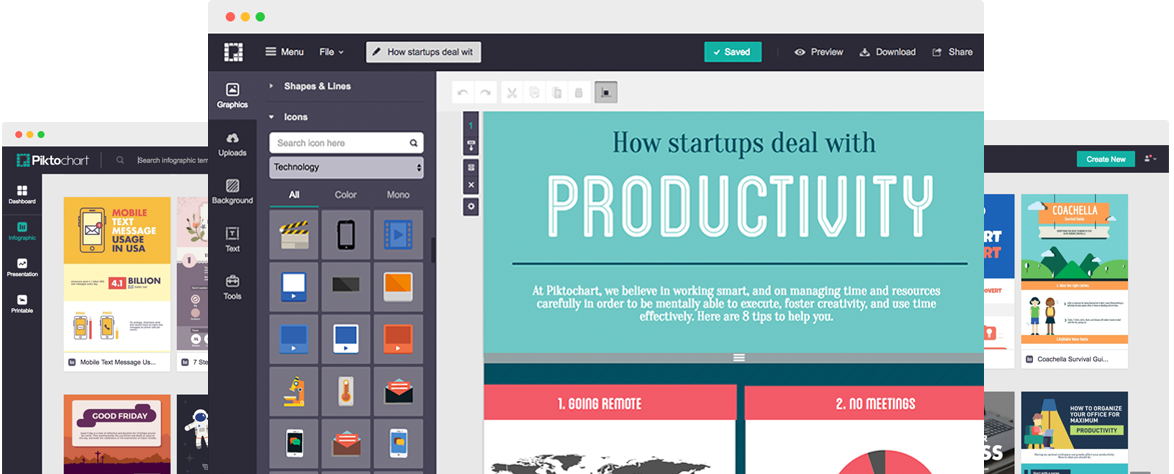
This presentation and infographic tool allows one to play with color schemes, fonts, shapes, graphics and images through its customizable editor. Additionally, it’s easier to align the elements using its grid lined templates. Due to such flexibility, creating an infographic using Piktochart is a matter of few minutes. It’s free version offers three basic themes whereas its pro account costs $29 per month or an annual cost of $169.
4. Venngage
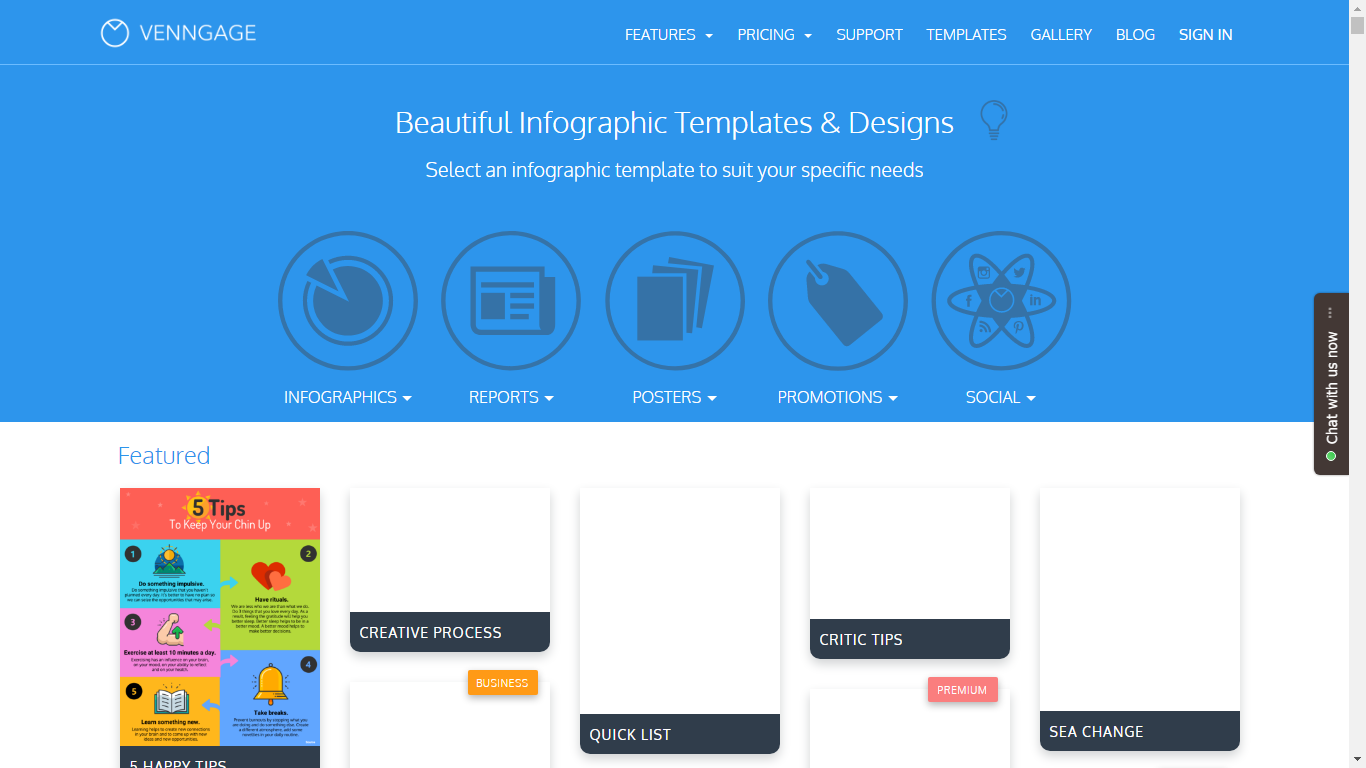
With the assistance of icons, images, graphs and other visuals, Venngage allows one to tell their story visually. This simple tool is a collection of a large number of themes, templates and icons. Also, it provides a feature of animating your creation. Along with infographics, one can create reports, promotions, posters and social media posts.
5. Easel.ly
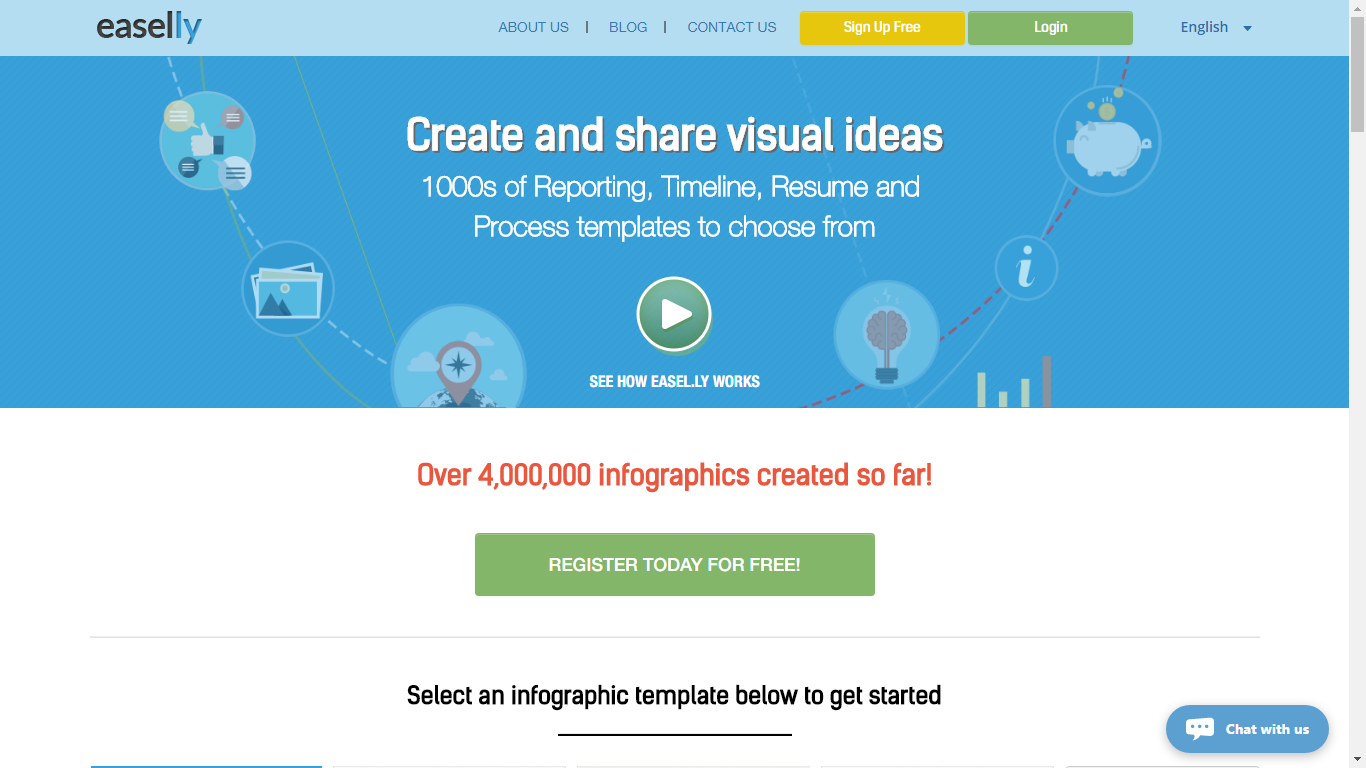
This web-based infographic tool is widely used due to its adaptability. It offers ample of free templates in its basic version, all of which are customizable. Furthermore, its library of icons, fonts, text styles and sizes is commendable. Using this tool one can position their uploaded graphic in one touch.
6. Visme
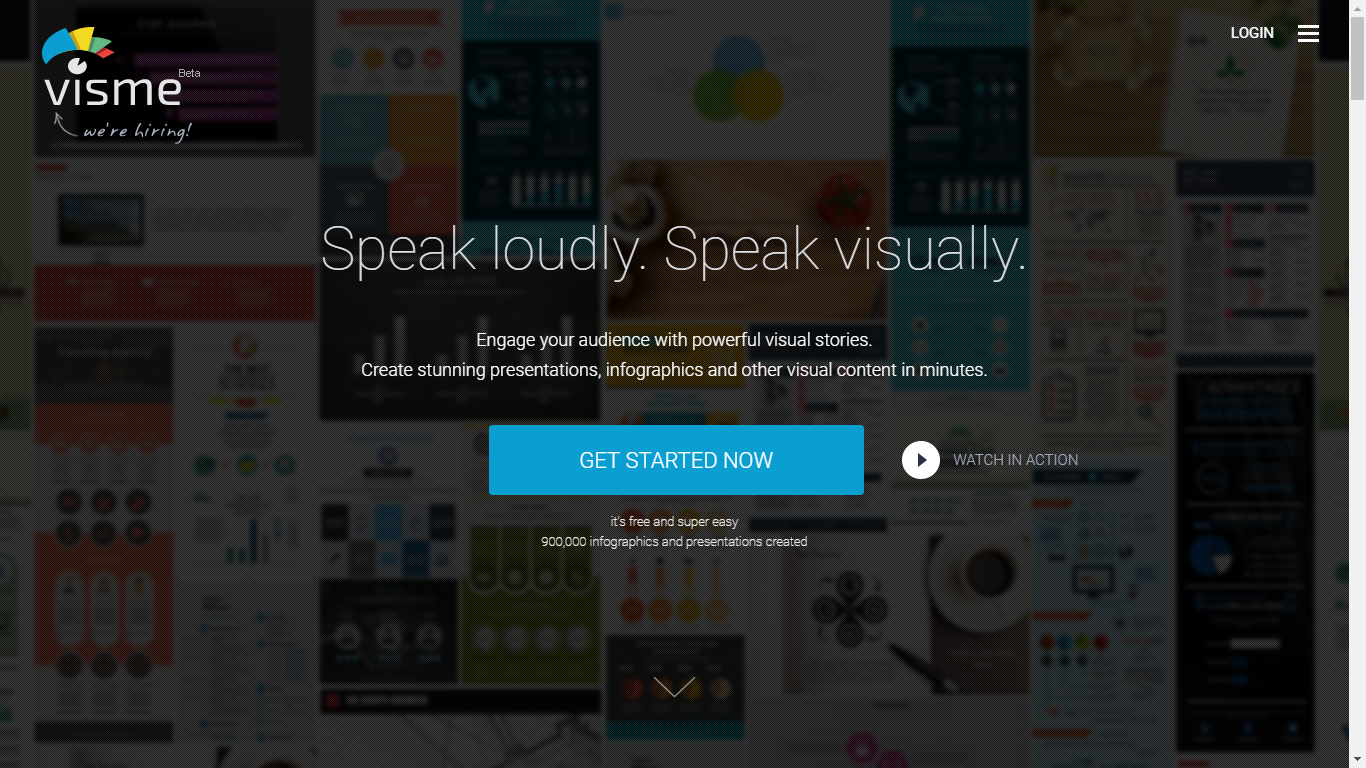
This infographic generator serves the purpose of multi usage. Utilizing its services, one can create extraordinary presentations, ad banners, animations and many more visual creations. In order to modify the graphs, one needs to directly insert data values. Though their premium plan is at an economical price of $16 per month, they offer special price for teachers and students.
7. Gravit
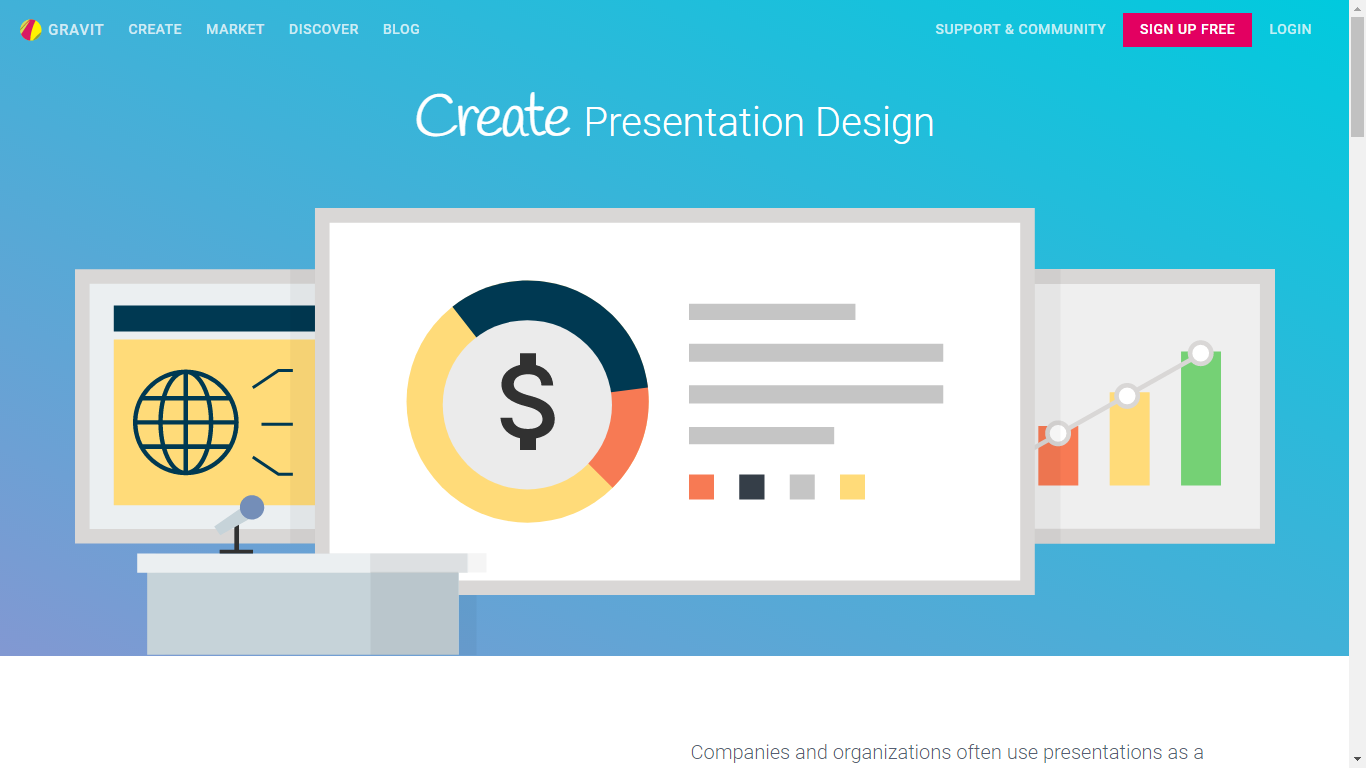
Accessible on MAC, Windows, Linux and ChromeOS, Gravit is a infographic tool that can be accessed from anywhere. It also has its extensions in modern browsers including Chrome, Firefox, Safari and Opera. This versatile design tool is used to design illustrators, branding graphics, social media creatives, presentations etc. Like its competitors, it also provides a massive library of relevant resources.
8. DesignBold
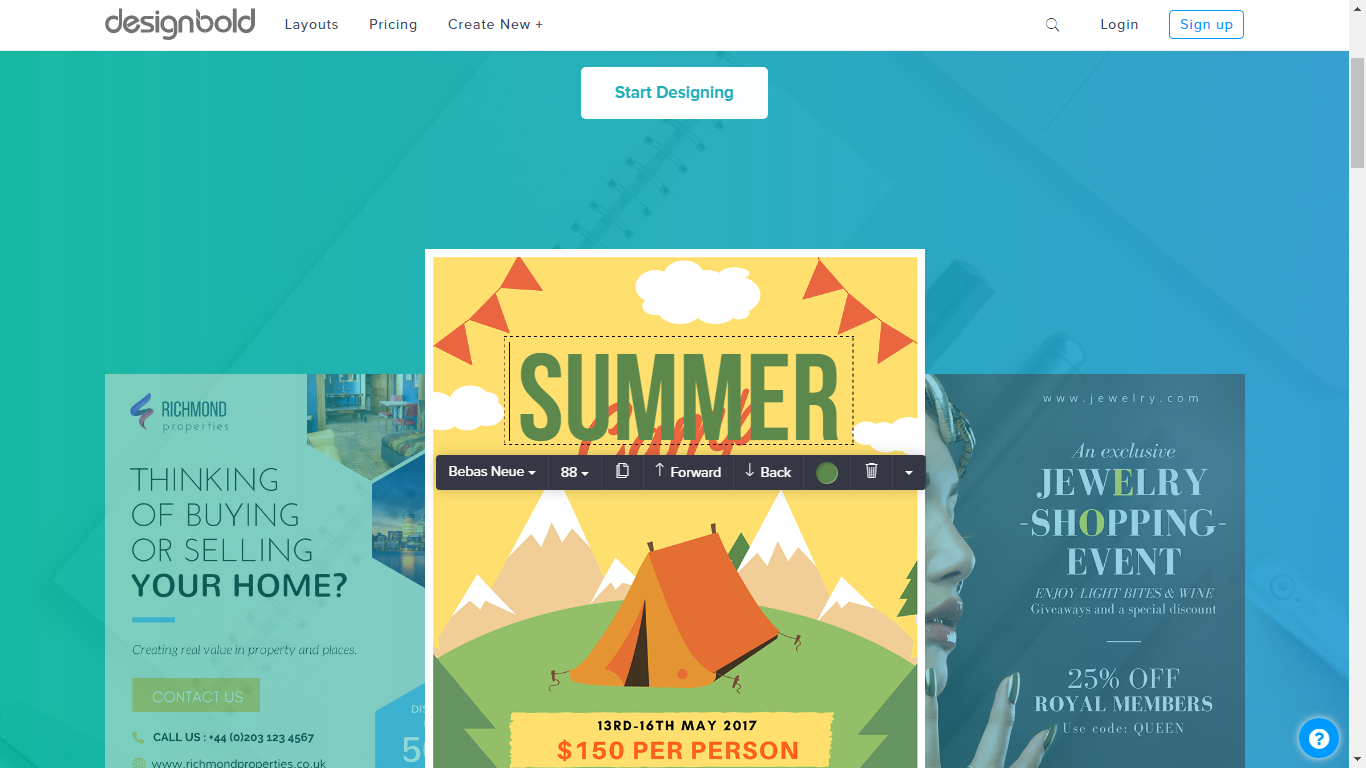
Though less popular than its fellow contenders, Designbold provides some really creative designs. It provides an amazing photo editor and a designer studio using which can be used to generate letterhead, resume, infographic, flyer, poster, invitation cards etc. It has an unbelievable stack of color shades, templates, icons, fonts, styles and many more.
9. Vizualize.me
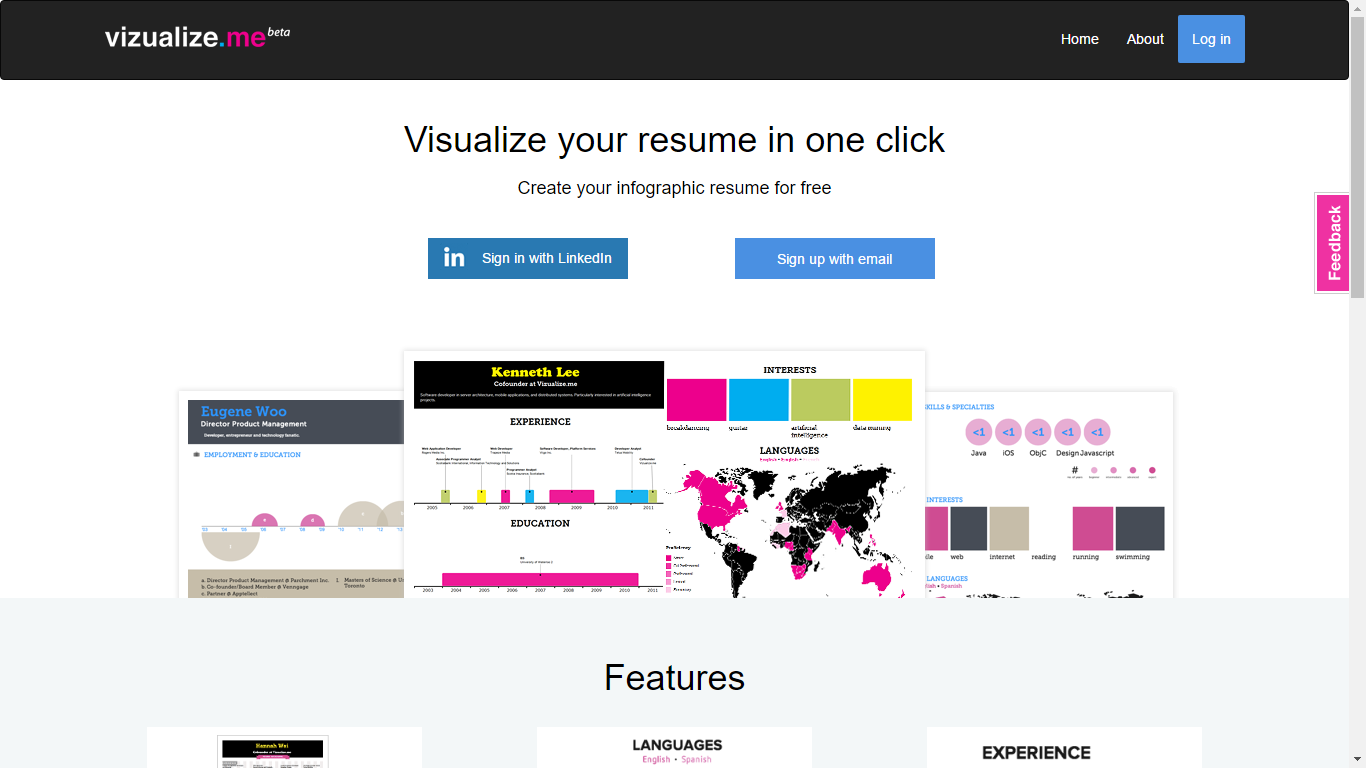
Though primarily focused on generating unique infographic resumes, the designs of Vizualize.me have a wider scope. Using this powerful website, one can visualize their resume in a single click. Vizualize.me has encouraged people to think out of the box and give their professional achievements a touch of a personalized creative essence. To be able to use its features, one needs to have signed in using LinkedIn or an email account. It provides a provision to select from a varied options of maps, timelines, charts, pictograms and many other formats.
10. PhotoADKing
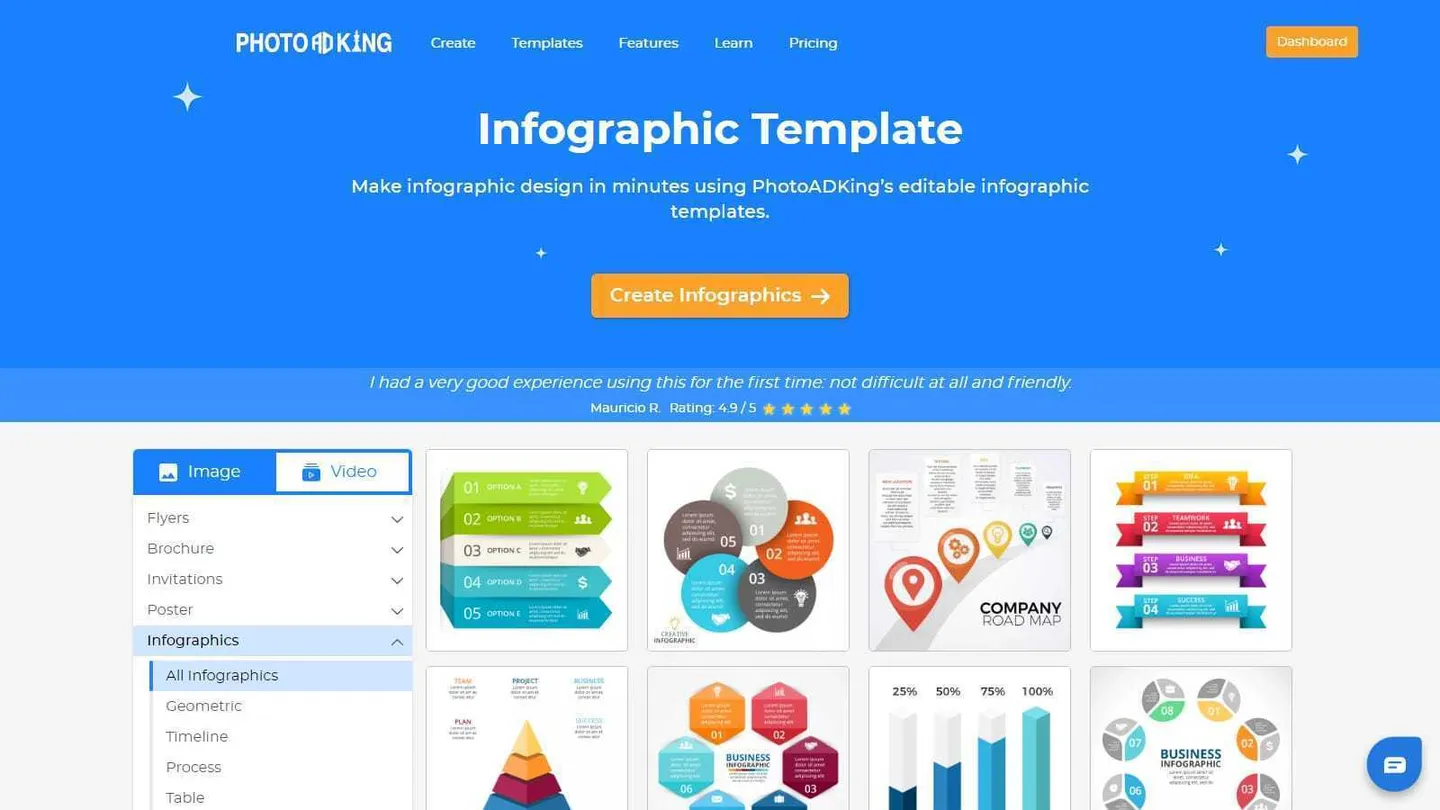
It is yet another one of the best infographic maker in the segment. PhotoADKing comes with plenty of unique and useful features for making outstanding designs. This platform has thousands of editable templates for infographics. The pricing for PhotoADKing is very reasonable, making it an affordable choice for those who want to create high-quality photos and designs without spending too much.
Related Blogs
Access the world's largest Design Ecosystem: Assets, Integrations, and Motion.


